QA/QC, Preprocessing & Levelling
Why preprocess my geochemical data?
Preprocessing of geoscientific data is a critical step in any exploration targeting program. Levelling of geochemical data is one of the most vital steps conducted in any preprocessing exercise. Numerous factors impact the variability of assayed values. These include but are not limited to analytical techniques, digestion methods, lithologies, lab methods, etc. Even differences in mesh size can impact the final assayed value.
To ensure anomalies do not go missed, and important geochemical signatures are identified, it is important to correct for these factors.
Value
Data preprocessing steps including levelling of geochemical data can:
- Reveal anomalies that may have otherwise been obscured.
- Improve confidence in target ranking
- Improve multivariate analysis and machine learning models by feeding them cleaner, more consistent inputs.
- Reduce the risk of false anomalies saving costly follow-up in less prospective areas.
Data before and after levelling
Below is an example of gold surface assay data before and after levelling, shown alongside known gold occurrences. The interactive map below illustrates the value of levelling on spatial anomaly patterns. Sliding the divider button to the right shows the unlevelled gridded gold assay data, while sliding to the left reveals the levelled result. Known gold occurrences are represented by yellow points.
In this example, levelling produces tighter and more spatially coherent anomalies that appear to align more closely with known gold occurrences. The levelled surface also shows clearer treatment of artefacts present in the northern part of the mapsheet.
The boxplots below show the distribution of standardised gold assay values across groups before and after levelling. Levelling removes the systematic offsets between populations, centering each group around a more comparable baseline, while preserving meaning and enhancing meaningful geochemical contrast.
Understanding your data
Before undertaking any data preprocessing tasks it is important to understand your data, warts and all. This is particularly relevant to exploration geochemical data, which is often multigenerational - spanning numerous companies, laboratory methods, and logging protocols. That is why the first step I undertake on any project is the generation of a data summary report.
This report covers aspects such as assay completeness (and censoring), spatial coverage of assayed suites, assessment of sample and lab method types, and value distributions. Documenting these attributes in an interactive report allows geologists to quickly evaluate data quality across their tenements. These reports also become a valuable reference when projects are revisited, and support discussions around where multivariate analysis can be meaningfully applied.
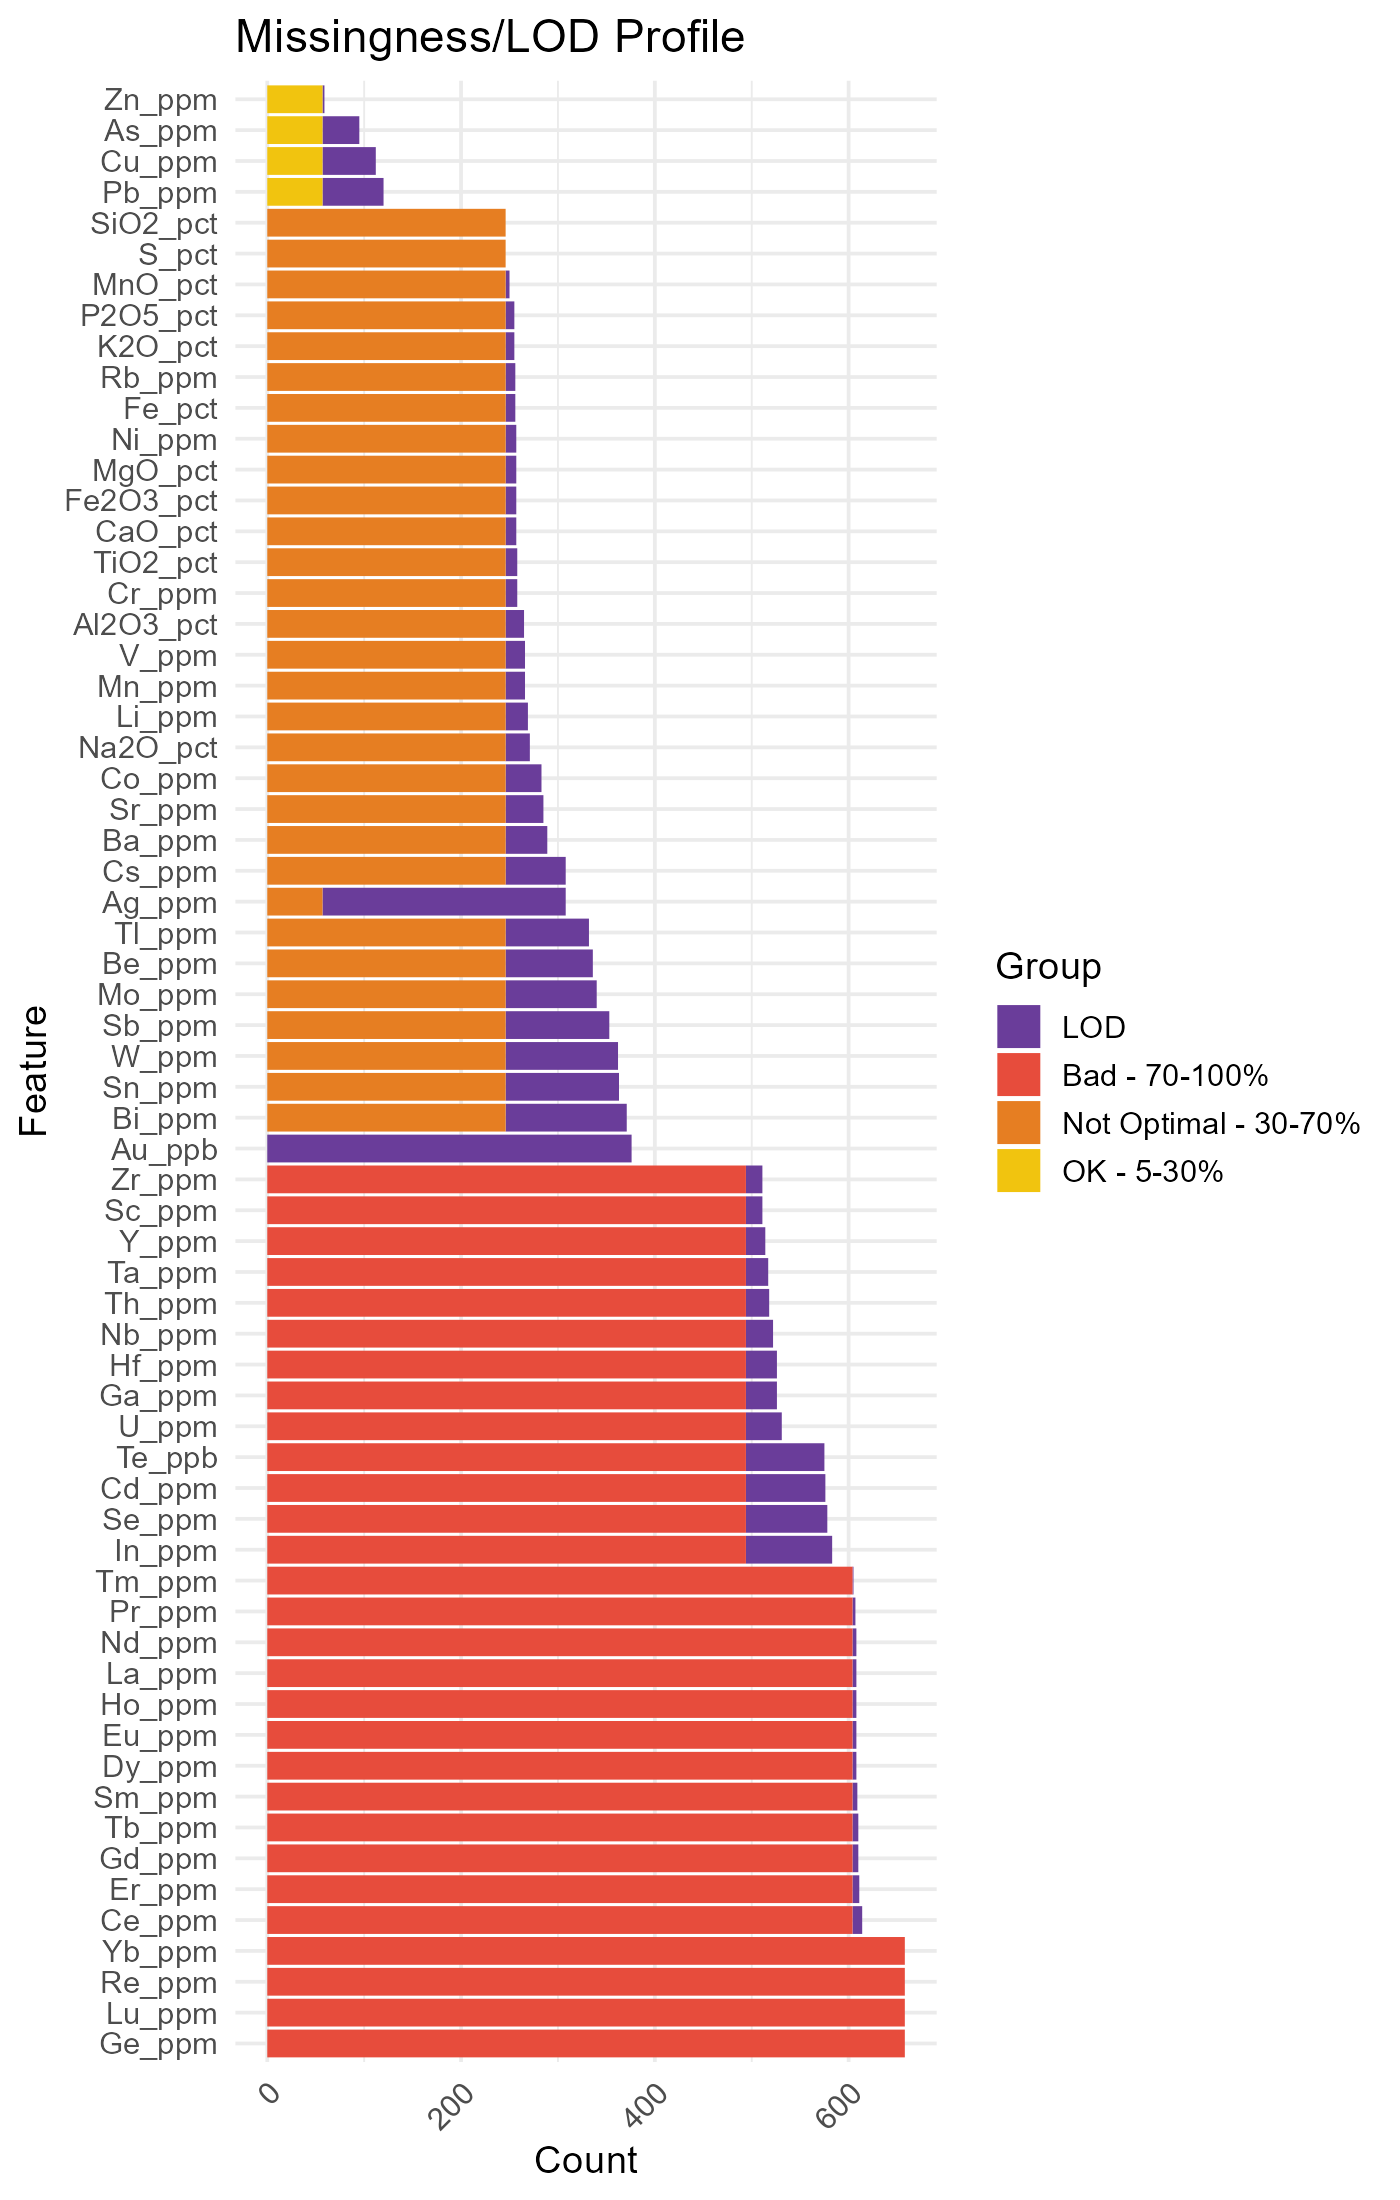
Below are two example outputs from a data summary report – a missingness profile that shows the count of samples missing values for each element (with purple flagging values returned below detection limit), and an interactive map showing the number of elements assayed per sample, making spatial gaps in multi-element coverage obvious at a glance (interactive legend to filter on/off samples).