Unsupervised Multivariate Analysis
Learning from geochemical data
Unsupervised learning is one of the most relevant and exciting applications of multivariate analysis to geoscientific data.
It provides the geologist with crucial geoscientific insights without applying any preconceived constraints on the data. This allows geologists to leverage their experience when interpreting model outputs. The outputs may reinforce existing ideas and/or raise potentially new hypotheses not previously considered.
"The greatest value of a picture is when it forces us to notice what we never expected to see."
Value
- Provide geoscientific insights without any preconceived constraints on the data.
- Differentiate rocktypes, alteration facies, weathered from fresh rock, etc.
- Improve drilling efficiency by enhancing/reinforcing alteration vectoring models.
- Provide exploration teams with fresh ideas/hypotheses or reinforce/challenge existing exploration models.
- Results best interpreted by geologists with knowledge of mineralisation style/geological terrain.
Clustering and vectoring examples
Unsupervised learning is a large field with many algorithms and exciting applications. Below we explore the application of two unsupervised techniques for analysing multielement geochemical data: cluster analysis and factor analysis. These techniques were applied to multielement drillhole geochemical data from the Tallenbung vein-hosted Sn deposit in New South Wales, Australia.
Please reach out if you are interested in discussing these, or additional unsupervised methods and how they may be applied to your geochemical or geophysical data.
Clustering is a powerful unsupervised technique which groups samples into groups based on similarities. There are numerous applications of clustering to geoscientific data such as differentiating different protoliths, identification of altered equivalents, differentiating regolith from saprock, anomaly identification, etc.
At Tallenbung, advanced clustering techniques were applied for the purpose of identifying altered equivalents in the sedimentary wallrock, and characterising their geochemical signatures. In doing so helping the exploration team to understand the palaeohydrothermal architecture and thus orient future drillholes.
Below is the output of the cluster model on the left alongside the results plotted in 3D. These charts are fully interactive and the legend can be used to turn off/on specific clusters in the spatial view (double clicking a legend item will isolate that specific class).
Straight away we can see that the cluster model has been able to differentiate weathered samples from freshrock using only the chemical assay values. The cluster model has also domained the mineralisation (yellow), as well as an alteration trend in the wallrock from Group 1 proximal to mineralisation (magenta), outwards through Groups 2 and 3, to the least altered rocks of Group 4.
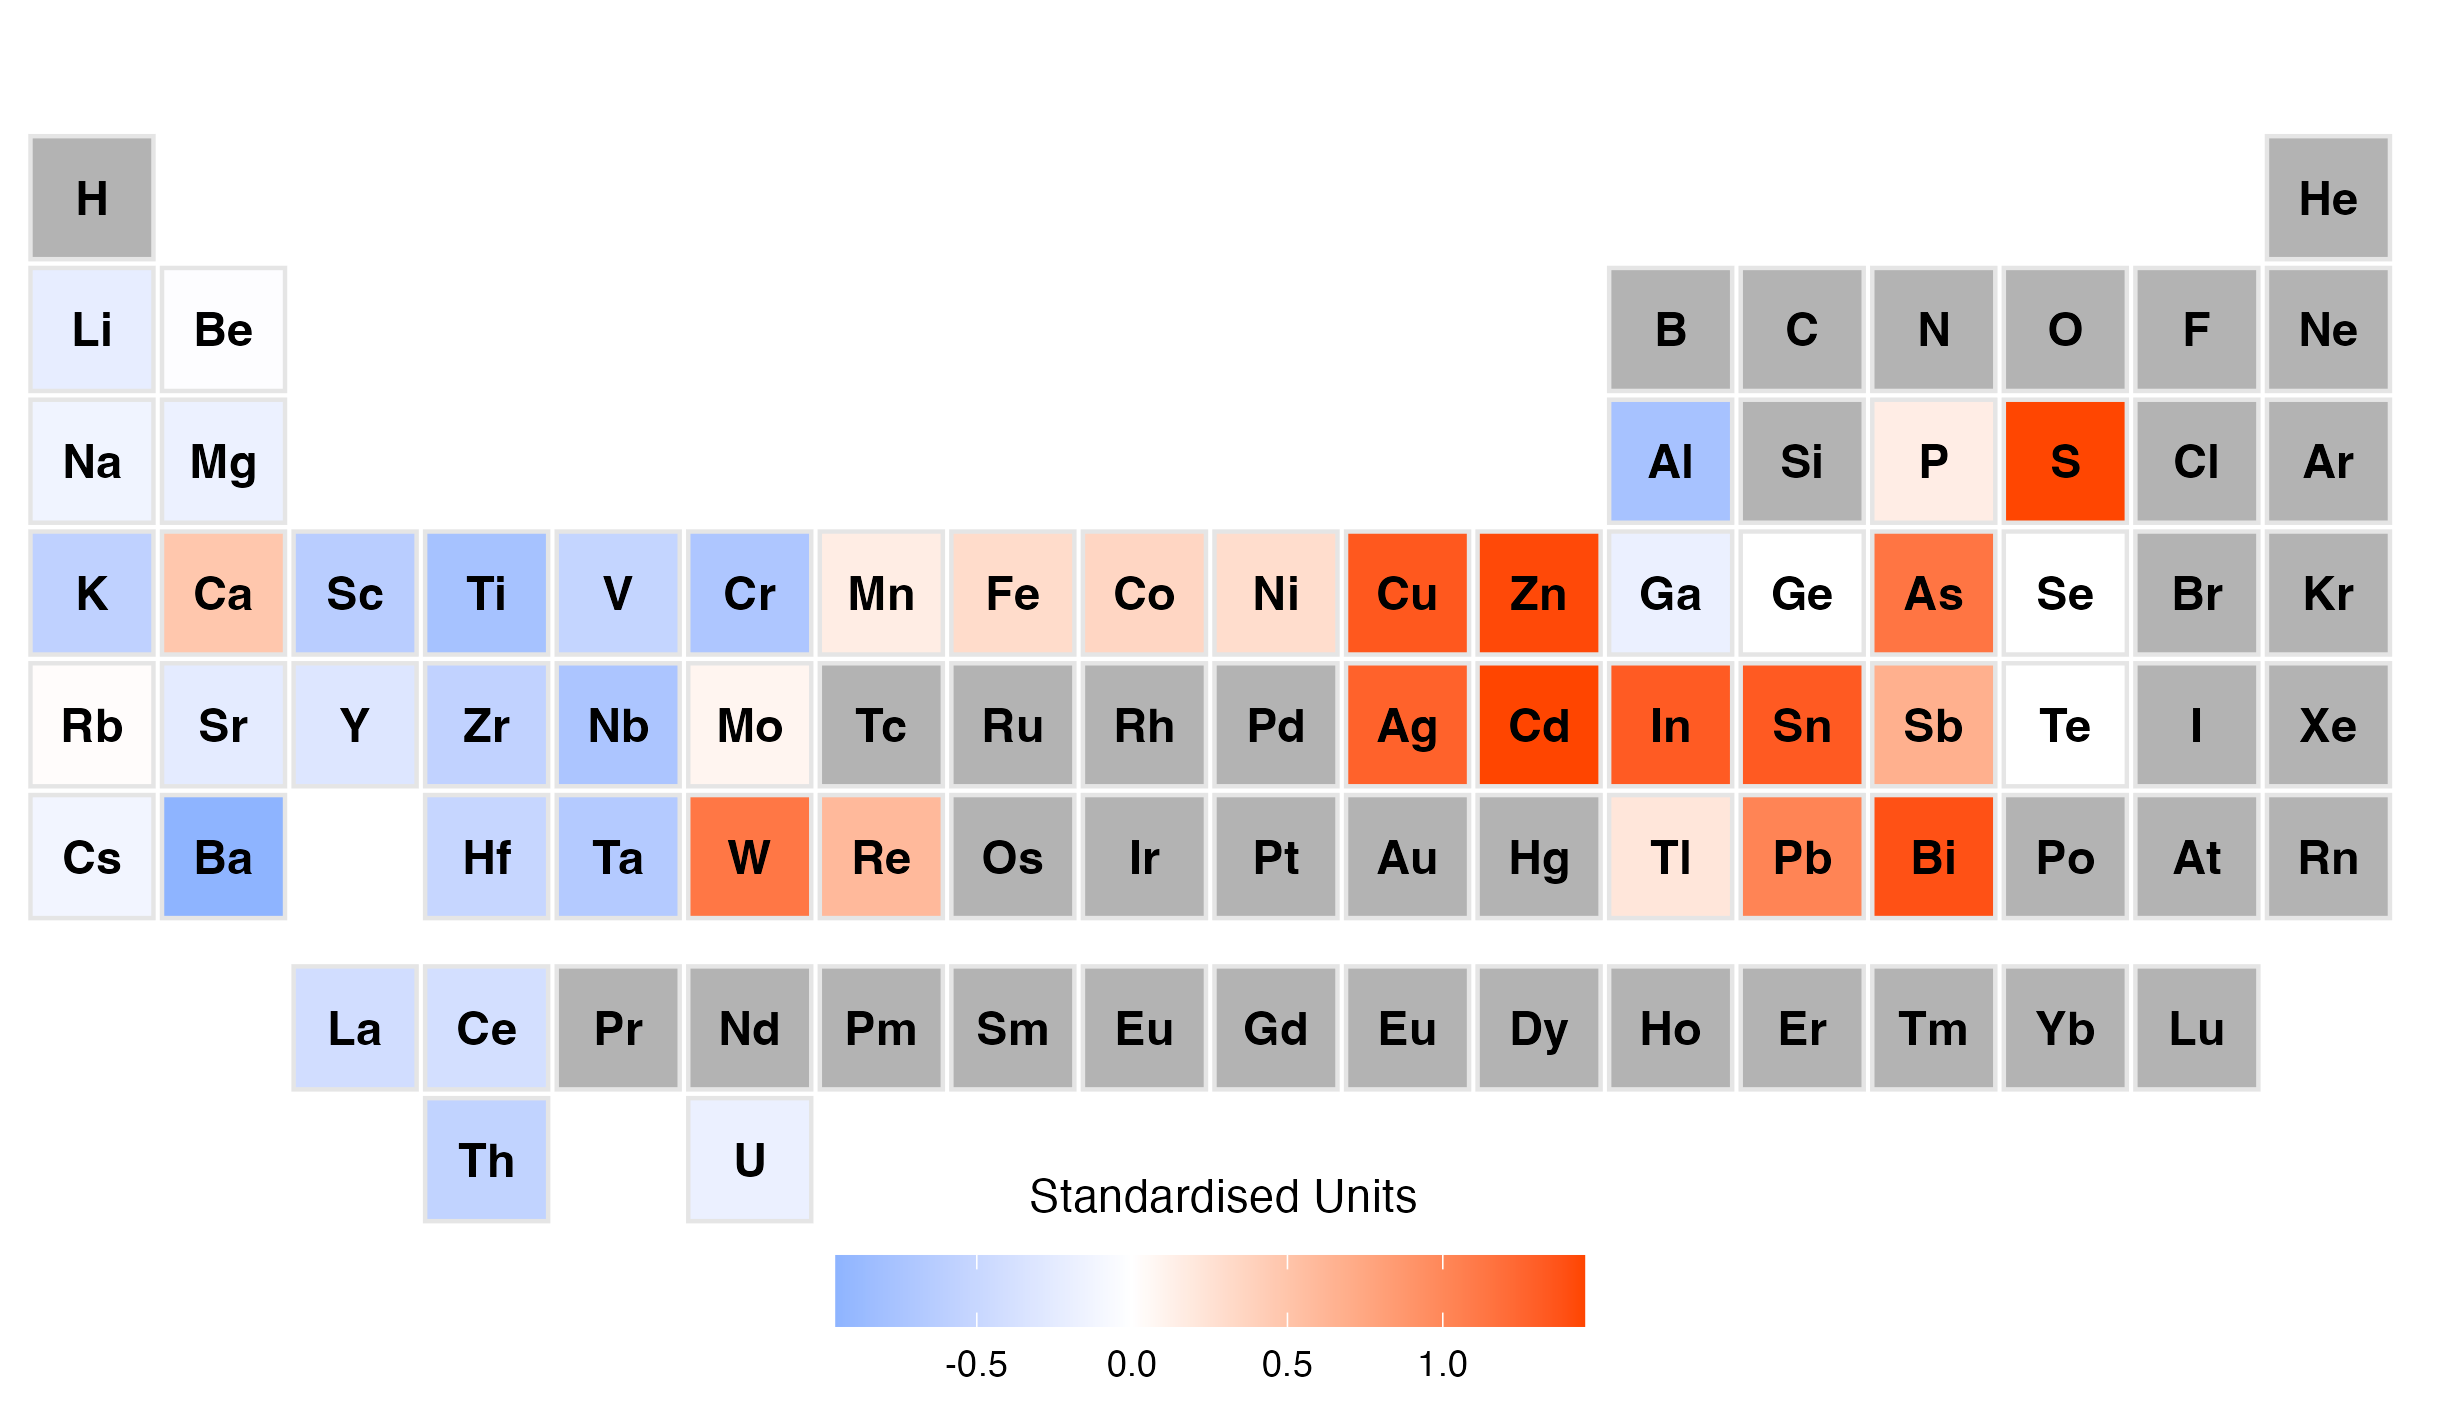
Analytics were then constructed for each clustered group in the interactive reports provided to the exploration team, allowing the geologists to put the geochemical results into a geological context, using their invaluable onsite domain knowledge. Below is a periodic table for the mineralised samples loaded with Sn and associated elements.